Tech Drive : Archive tech diaries of beeyeas@gmail.com
APM ( Application Performance Management ) and Distributed Tracing...
Inspired by Dapper few below trending...
http://opentracing.io/documentation/ : A standard for tracing ( https://github.com/opentracing/specification/issues/86 )
https://github.com/jaegertracing/jaeger
https://github.com/jaegertracing
https://zipkin.io/
https://medium.com/opentracing/distributed-tracing-in-10-minutes-51b378ee40f1
Wednesday, February 7, 2018


WeaveScope for micro-service discovery and monitoring
Tech Drive : Archive tech diaries of beeyeas@gmail.com
Weave Scope (https://github.com/weaveworks/scope) is the one tool i have been using for a while and forgot to jot it here...
Pretty well done, and i still see activity in commits here
Funding : i see weavescope is well funded GV ( Google Ventures ) , sounds good on the whole
https://www.crunchbase.com/organization/weaveworks
Install : https://www.weave.works/docs/scope/latest/installing/
Weave Scope (https://github.com/weaveworks/scope) is the one tool i have been using for a while and forgot to jot it here...
Pretty well done, and i still see activity in commits here
Funding : i see weavescope is well funded GV ( Google Ventures ) , sounds good on the whole
https://www.crunchbase.com/organization/weaveworks
Install : https://www.weave.works/docs/scope/latest/installing/
sudo curl -L git.io/scope -o /usr/local/bin/scope
sudo chmod a+x /usr/local/bin/scope
scope launchSunday, June 4, 2017
Network Traffic Analysis
Goal :
Situation :
"Recently I needed some NetFlow data samples, I’ve looked all over the internet for some of those, but for obvious privacy reasons there were none. No one shares their NetFlow data. Not even a little sample. So what could I do, I had no Cisco equipments to generate traffic on and then to collect it in data flows. So I’ve improvised by using my laptop as a router in the campus network and collecting the traffic that went through it in data flows. This post is about how to generate and collect Netflow data on your own network."
Tools used :
/etc/default/softflowd file and define the INTERFACE and OPTIONS variables as follows:
#sudo softflowctl -c /var/run/softflowd.ctl statistics
#sudo softflowctl -c /var/run/softflowd.ctl expire-all
#nfdump -R /var/cache/nfdump/ | head -5
nfsen : A nice visualization tool for
Download nfsen-1.3.8 bundle
#tar -xvf nfsen-1.3.8.tar.gz
#cd nfsen-1.3.8/
Make sure you make a copy of nfsen.conf template and ready for editing it
#sudo ./install.pl etc/nfsen.conf
#sudo apt-get install rrdtool
#sudo ./install.pl etc/nfsen.conf
#perl -MCPAN -e 'install RRD::Simple'
#wget http://oss.oetiker.ch/rrdtool/pub/rrdtool-1.4.3.tar.gz
#gunzip -c rrdtool-1.4.3.tar.gz | tar xf -
#cd rrdtool-1.4.3/
#sudo apt-get install libpangol.0-dev libxml2-dev
#sudo apt-get install libpangol.O-dev libxml2-dev
#sudo apt-get install libpango1.0-dev libxml2-dev
#./configure --prefix=$INSTALL_DIR && make && make install
#sudo ./configure --prefix=$INSTALL_DIR && make && make install
#sudo ./install.pl etc/nfsen.conf
#sudo ./install.pl etc/nfsen.conf
#aptitude install rrdtool librrd2-dev librrd-dev librrd4 librrds-perl librrdp-perl
#sudo aptitude install rrdtool librrd2-dev librrd-dev librrd4 librrds-perl librrdp-perl
#sudo apt-get install php5
#netstat -autn | grep -i listen
#vi etc/nfsen.conf
#sudo useradd -d /var/netflow -G www-data -m -s /bin/false netflow
#sudo perl install.pl etc/nfsen.conf
#vi etc/nfsen.conf
#sudo perl install.pl etc/nfsen.conf
#sudo instmodsh
#sudo perl -MCPAN -e 'install Mail::Header'
#sudo perl install.pl etc/nfsen.conf
#sudo perl -MCPAN -e 'install Socket6'
#sudo perl install.pl etc/nfsen.conf
#sudo ps -ef | grep nfsen
#sudo ./nfsen start
Enable apache2.conf for nfsen web folders
#sudo nano /etc/apache2/sites-available/000-default.conf
#sudo vi /etc/apache2/apache2.conf
References :
- Generate netflow traffic (simulator) in linux box
- Map the generated data as visual graphs
Situation :
"Recently I needed some NetFlow data samples, I’ve looked all over the internet for some of those, but for obvious privacy reasons there were none. No one shares their NetFlow data. Not even a little sample. So what could I do, I had no Cisco equipments to generate traffic on and then to collect it in data flows. So I’ve improvised by using my laptop as a router in the campus network and collecting the traffic that went through it in data flows. This post is about how to generate and collect Netflow data on your own network."
Tools used :
- softflowd : https://github.com/davidediger/softflowd : Netflow generator daemon
- nfdump : https://github.com/phaag/nfdump : Netflow dump
- nfsen : https://github.com/sown/nfsen : Visualization tool for nfdump
# apt-get install softflowd
INTERFACES = "any"
OPTIONS = "-n 127.0.0.1:9995"
# /etc/init.d/softflowd start
If you don’t want to wait for the flows to expire, you may force them to by running this:
# softflowd -c /var/run/softflowd.ctl expire-all
nfdump - install and test the collector
The nfdump package is a suite of tools, one of which is nfcapd, which is the collector, and nfdump which is the display and analysis program. There are some other tools included as well, but those are the major commands we need to know about. To install nfdump run:
# apt-get install nfdump
# nfcapd -D -l /var/cache/nfdump
# lsof -Pni | grep nfcapd
We should wait awhile for some data to be produced, but to see what that data looks like we could run the following command:
# nfdump -R /var/cache/nfdump/ | head -5
Date first seen          Duration Proto      Src IP Addr:Port          Dst IP Addr:Port   Packets    Bytes Flows
2015-09-10 18:45:05.243     0.000 UDP     158.121.23.138:59026 ->   158.121.23.255:8083         1       49     1
2015-09-10 18:45:08.107     0.000 UDP      158.121.22.94:68    ->  255.255.255.255:67           2      656     1
2015-09-10 18:42:29.532   161.807 UDP       158.121.23.0:68    ->  255.255.255.255:67           3      984     1
2015-09-10 18:45:08.458     4.103 UDP      158.121.22.94:137   ->   158.121.23.255:137          4      312     1
#sudo softflowctl -c /var/run/softflowd.ctl expire-all
#nfdump -R /var/cache/nfdump/ | head -5
nfsen : A nice visualization tool for
Download nfsen-1.3.8 bundle
#tar -xvf nfsen-1.3.8.tar.gz
#cd nfsen-1.3.8/
Make sure you make a copy of nfsen.conf template and ready for editing it
#sudo ./install.pl etc/nfsen.conf
#sudo apt-get install rrdtool
#sudo ./install.pl etc/nfsen.conf
#perl -MCPAN -e 'install RRD::Simple'
#wget http://oss.oetiker.ch/rrdtool/pub/rrdtool-1.4.3.tar.gz
#gunzip -c rrdtool-1.4.3.tar.gz | tar xf -
#cd rrdtool-1.4.3/
#sudo apt-get install libpangol.0-dev libxml2-dev
#sudo apt-get install libpangol.O-dev libxml2-dev
#sudo apt-get install libpango1.0-dev libxml2-dev
#./configure --prefix=$INSTALL_DIR && make && make install
#sudo ./configure --prefix=$INSTALL_DIR && make && make install
#sudo ./install.pl etc/nfsen.conf
#sudo ./install.pl etc/nfsen.conf
#aptitude install rrdtool librrd2-dev librrd-dev librrd4 librrds-perl librrdp-perl
#sudo aptitude install rrdtool librrd2-dev librrd-dev librrd4 librrds-perl librrdp-perl
#sudo apt-get install php5
#netstat -autn | grep -i listen
#vi etc/nfsen.conf
#sudo useradd -d /var/netflow -G www-data -m -s /bin/false netflow
#sudo perl install.pl etc/nfsen.conf
#vi etc/nfsen.conf
#sudo perl install.pl etc/nfsen.conf
#sudo instmodsh
#sudo perl -MCPAN -e 'install Mail::Header'
#sudo perl install.pl etc/nfsen.conf
#sudo perl -MCPAN -e 'install Socket6'
#sudo perl install.pl etc/nfsen.conf
#sudo ps -ef | grep nfsen
#sudo ./nfsen start
#sudo nano /etc/apache2/sites-available/000-default.conf
#sudo vi /etc/apache2/apache2.conf
References :
- All above are documented here : https://github.com/beeyeas/spark-playground/tree/master/netflow
- nfsen : http://nfsen.sourceforge.net/#mozTocId778656
- http://elf11.github.io/2015/09/10/NetFlows-data-generation.html
- http://meetings.ripe.net/ripe-50/presentations/ripe50-plenary-tue-nfsen-nfdump.pdf
- https://farisy18.wordpress.com/tag/rrdtool/
Wednesday, April 19, 2017
Scalable SQL like data store ( cockroach DB )
I happened to try something cool this week, where the traditional SQL databases failed to solve these challenges.
MySQL, Postgres or Oracle all have HA and replication, backup and recovery but these are still a huge monolith of data stores spanning huge volumes of disks.
The traditional way of solving these would be the sharding of db ( db-federation ) ...segregating reads and write to different instances ( PS : https://www.brentozar.com/articles/sharding/)
Scale up : is to load a server instance with more resources (CPU, Memory ... )
Scale out : is to create more instance of server ( this needs sufficient network pipe ...)
Scale out solution with db sharding could be of 3 choices
1. Range Partitoning
2. List Partitioning
3. Consistent Hashing ( wow, i learned this in the context of load balancer )
Now, with all these traditional approaches.
How distributed systems could solve this elegantly ( how i got glued to cockroachDB )
2. Start the first cockroach DB node
#docker run -d --name=roach1 --hostname=roach1 --net=roachnet -p 26257:26257 -p 8080:8080 -v "${PWD}/cockroach-data/roach1:/cockroach/cockroach-data" cockroachdb/cockroach:beta-20170413 start --insecure
3. Start the second cockroach DB node
#docker run': docker run -d --name=roach2 --hostname=roach2 --net=roachnet -v "${PWD}/cockroach-data/roach2:/cockroach/cockroach-data" cockroachdb/cockroach:beta-20170413 start --insecure --join=roach1
4.Start the third cockroach DB node
#docker run': docker run -d --name=roach3 --hostname=roach3 --net=roachnet -v "${PWD}/cockroach-data/roach3:/cockroach/cockroach-data" cockroachdb/cockroach:beta-20170413 start --insecure --join=roach1
Voila , cockroachDB with 3 nodes are up and running
docker ps
CONTAINER ID IMAGE COMMAND CREATED STATUS PORTS NAMES
e1940aab526f cockroachdb/cockroach:beta-20170413 "/cockroach/cockro..." 46 hours ago Up 46 hours 8080/tcp, 26257/tcp roach3
93939da8b5f8 cockroachdb/cockroach:beta-20170413 "/cockroach/cockro..." 46 hours ago Up 46 hours 8080/tcp, 26257/tcp roach2
466fd24c9720 cockroachdb/cockroach:beta-20170413 "/cockroach/cockro..." 46 hours ago Up 46 hours 0.0.0.0:8080->8080/tcp, 0.0.0.0:26257->26257/tcp roach1
MySQL, Postgres or Oracle all have HA and replication, backup and recovery but these are still a huge monolith of data stores spanning huge volumes of disks.
The traditional way of solving these would be the sharding of db ( db-federation ) ...segregating reads and write to different instances ( PS : https://www.brentozar.com/articles/sharding/)
Scale up : is to load a server instance with more resources (CPU, Memory ... )
Scale out : is to create more instance of server ( this needs sufficient network pipe ...)
Scale out solution with db sharding could be of 3 choices
1. Range Partitoning
2. List Partitioning
3. Consistent Hashing ( wow, i learned this in the context of load balancer )
Now, with all these traditional approaches.
How distributed systems could solve this elegantly ( how i got glued to cockroachDB )
Cloud spanner :
- is from google, its is a light weight distributed data store which can be SQL queried.
- Release in early 2017 , a quite internal customer inside google for many years
- Has libraries for go, java, nodes, python
CockroachDB :
- A on-prem solution is from cockroach labs https://github.com/cockroachdb/cockroach
- Light weight go-lang implementation uses confesses protocol in the backend , gossip and raft.
- Very easy to set up , can start as docker over the docker network bridge
- These guys are from google who did spanner implementation for google, lets hope for the best
Amazon Athena :
- Is a similar SQL based distributed data store , but it is server less.
- Metered only when query is fired on data sets.
- Cool editor to handle SQL queries , handed data from S3 buckets
How easy to get started with cockroach DB ?
1.Create a docker network "roachnet"
#docker network create -d bridge roachnet
#docker run -d --name=roach1 --hostname=roach1 --net=roachnet -p 26257:26257 -p 8080:8080 -v "${PWD}/cockroach-data/roach1:/cockroach/cockroach-data" cockroachdb/cockroach:beta-20170413 start --insecure
3. Start the second cockroach DB node
#docker run': docker run -d --name=roach2 --hostname=roach2 --net=roachnet -v "${PWD}/cockroach-data/roach2:/cockroach/cockroach-data" cockroachdb/cockroach:beta-20170413 start --insecure --join=roach1
4.Start the third cockroach DB node
#docker run': docker run -d --name=roach3 --hostname=roach3 --net=roachnet -v "${PWD}/cockroach-data/roach3:/cockroach/cockroach-data" cockroachdb/cockroach:beta-20170413 start --insecure --join=roach1
Voila , cockroachDB with 3 nodes are up and running
docker ps
CONTAINER ID IMAGE COMMAND CREATED STATUS PORTS NAMES
e1940aab526f cockroachdb/cockroach:beta-20170413 "/cockroach/cockro..." 46 hours ago Up 46 hours 8080/tcp, 26257/tcp roach3
93939da8b5f8 cockroachdb/cockroach:beta-20170413 "/cockroach/cockro..." 46 hours ago Up 46 hours 8080/tcp, 26257/tcp roach2
466fd24c9720 cockroachdb/cockroach:beta-20170413 "/cockroach/cockro..." 46 hours ago Up 46 hours 0.0.0.0:8080->8080/tcp, 0.0.0.0:26257->26257/tcp roach1
Wednesday, April 5, 2017
Deploying Influx TICK Stack on K8
My goal here is to stand-up TICK stack for monitoring K8-clusters
Reference : https://www.influxdata.com/how-to-spin-up-the-tick-stack-in-a-kubernetes-instance/
Follow here https://github.com/influxdata/tick-charts
Kubernetes Dashboard showing TICK stack after HELM Deployment


Follow here https://github.com/influxdata/tick-charts
Kubernetes Dashboard showing TICK stack after HELM Deployment


Friday, March 3, 2017
K8 (Kube) Package Manager - Helm
I see helm as analogous to AWS Cloud Formation
https://github.com/kubernetes/helm
Helm is the package manager for kubenetes. It in-turn uses kubenetes charts .

https://github.com/kubernetes/helm
Helm is the package manager for kubenetes. It in-turn uses kubenetes charts .
Helm is a tool for managing Kubernetes charts. Charts are packages of pre-configured Kubernetes resources.
Use Helm to...
- Find and use popular software packaged as Kubernetes charts
- Share your own applications as Kubernetes charts
- Create reproducible builds of your Kubernetes applications
- Intelligently manage your Kubernetes manifest files
- Manage releases of Helm packages

Helm is the tool to load charts into K8 for application deployment
Thursday, March 2, 2017
WTF is "Open Source Core"
I recently came across this term and it sounds cool and practical to me.
Thought of sharing it here, as i suddenly realized i have this in my screen all over...
Example : Look at https://www.influxdata.com/products/ , formerly influx DB.
They have real good products (influxcloud, influxEnterprise, TICK stack), inturn all of these are just one "A Real-Time Monitoring Solution"
In data center we host tons of application and we need a true solution for monitoring, there are tons of monitoring solutions datadog, new relic, etc... but all are closed products.
The power of "Open Source Core" is the whole complex product is open sourced ( githubbed )
, but the niche feature to take it to enterprise or integrate will be the monetizing way.
That is , in this example Influx Enterprise is the Monetizing product.
Another example : Hashicorp
https://www.hashicorp.com/
Famously called "Hashi-stack", open sourced all their core complex products.
Vagrant, Packer, Vault, Consul, Terraform. But their enterprise version and another niche product atlas is their monetizing product.
https://overcast.fm/+HZUc5QQ4k/35:07
Thought of sharing it here, as i suddenly realized i have this in my screen all over...
Example : Look at https://www.influxdata.com/products/ , formerly influx DB.
They have real good products (influxcloud, influxEnterprise, TICK stack), inturn all of these are just one "A Real-Time Monitoring Solution"
In data center we host tons of application and we need a true solution for monitoring, there are tons of monitoring solutions datadog, new relic, etc... but all are closed products.
The power of "Open Source Core" is the whole complex product is open sourced ( githubbed )
, but the niche feature to take it to enterprise or integrate will be the monetizing way.
That is , in this example Influx Enterprise is the Monetizing product.
Another example : Hashicorp
https://www.hashicorp.com/
Famously called "Hashi-stack", open sourced all their core complex products.
Vagrant, Packer, Vault, Consul, Terraform. But their enterprise version and another niche product atlas is their monetizing product.
https://overcast.fm/+HZUc5QQ4k/35:07
Mesosphere DC/OS installation
I am playing around with DC/OS and tried to install it on GCE ( Google Cloud Engine )
I blindly followed https://dcos.io/docs/1.8/administration/installing/cloud/gce/#configure
and saw stars at the end ( well, spinning around my head ) .
Not so good documentation, end result : "nothing works"
I was hoping i will improve this documentation with my experience of installing in GCE, but i failed miserably , could not achieve what i want to do.
Ok, what really happened
I followed the instruction in DC/OS documentation but could not get the DC/OS up and running.
1. https://dcos.io/docs/1.8/administration/installing/cloud/gce/#bootstrap :
Easy and got this working
2. https://dcos.io/docs/1.8/administration/installing/cloud/gce/#install :
These are ansible powered and calls GCE API to provision a master0 node and then agent-nodes, all works fine with slight tweek to ansible, it did not run the first time as documented.
3. https://dcos.io/docs/1.8/administration/installing/cloud/gce/#configure : Failed
I wanted to be sure if i really installed DC/OS stack and was i successful?
I could not see the mesos, marathon or DCOS. Err:FAILED.
All i have done so far is bring up 3 VMs in my GCE.
I wish this document gets better and a cleaner support ....
BTW : A good pod to listen to https://overcast.fm/+I_rT72mY/41:07
I blindly followed https://dcos.io/docs/1.8/administration/installing/cloud/gce/#configure
and saw stars at the end ( well, spinning around my head ) .
Not so good documentation, end result : "nothing works"
I was hoping i will improve this documentation with my experience of installing in GCE, but i failed miserably , could not achieve what i want to do.
Ok, what really happened
I followed the instruction in DC/OS documentation but could not get the DC/OS up and running.
1. https://dcos.io/docs/1.8/administration/installing/cloud/gce/#bootstrap :
Easy and got this working
2. https://dcos.io/docs/1.8/administration/installing/cloud/gce/#install :
These are ansible powered and calls GCE API to provision a master0 node and then agent-nodes, all works fine with slight tweek to ansible, it did not run the first time as documented.
3. https://dcos.io/docs/1.8/administration/installing/cloud/gce/#configure : Failed
I wanted to be sure if i really installed DC/OS stack and was i successful?
I could not see the mesos, marathon or DCOS. Err:FAILED.
All i have done so far is bring up 3 VMs in my GCE.
I wish this document gets better and a cleaner support ....
BTW : A good pod to listen to https://overcast.fm/+I_rT72mY/41:07
Wednesday, March 1, 2017
How to run graylog cluster in GKE(Google Container Engine)
With reference to another article i wrote earlier on how to run graylog cluster in kubenetes here ( http://beeyeas.blogspot.com/2017/02/how-to-run-graylog-cluster-in-kubernetes.html) , it was the way to run graylog ( mongo, elastic and graylog server) to-gether in one single container instance in minikube.
Here i take another attempt to run micro-services container of mongodb, elastic-search and graylog2 in google cloud platform - google container engine( GKE )
Step1 : See here (http://beeyeas.blogspot.com/2017/02/gke-google-container-engine.html) , how to bring up GKE ( kubenetes instance )
I assume, you followed the instructions here correctly and have "kubectl" CLI configured correctly to point to your gcloud GKE instance.
Make sure you can access kubenetes dashboard , for which you have to proxy service
#kubectl proxy
Step 2 : get the kubenetes service and deployment files here ( https://github.com/beeyeas/graylog-kube ), clone repo
Step 3 : Create mongo, elasticsearch, graylog
#kubectl create -f mongo-service.yaml,mongo-deployment.yaml
#kubectl create -f elasticsearch-deployment.yaml,elasticsearch-service.yaml
#kubectl create -f graylog-deployment.yaml,graylog-service.yaml
Step 4 : forward graylog UI to local 19000 port
#kubectl port-forward graylog-2041601814-5qnbc 9000:9000
Step 5 : Verify if all services are up
#kubectl get services
NAME CLUSTER-IP EXTERNAL-IP PORT(S) AGE
elasticsearch None <none> 55555/TCP 1h
graylog 10.3.248.24 <none> 9000/TCP,12201/TCP 1h
kubernetes 10.3.240.1 <none> 443/TCP 1d
mongo None <none> 55555/TCP 1h
NOTE: Access localhost:9000 for graylog UI
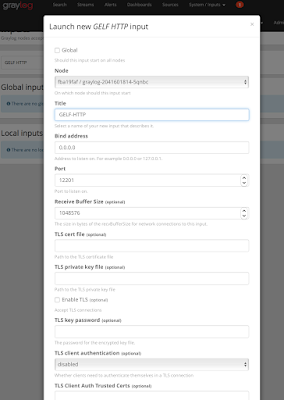
Step 6 : Graylog UI is empty and do not have any logs to index or show , i have exposed port number 12201. Create a port forward for graylog input GELF HTTP
Make sure you got this screen configured in graylog, configurig GELF-HTTP in graylog
#kubectl port-forward graylog-2041601814-5qnbc 12201:12201
for i in {1..100000}; do curl -XPOST 127.0.0.1:12201/gelf -p0 -d '{"short_message":"Hello there", "host":"example.org", "facility":"test", "_foo":"bar"}'; done
After step 7 where you pump the logs, see if logs are showing up in the graylog UI

Here i take another attempt to run micro-services container of mongodb, elastic-search and graylog2 in google cloud platform - google container engine( GKE )
Step1 : See here (http://beeyeas.blogspot.com/2017/02/gke-google-container-engine.html) , how to bring up GKE ( kubenetes instance )
I assume, you followed the instructions here correctly and have "kubectl" CLI configured correctly to point to your gcloud GKE instance.
Make sure you can access kubenetes dashboard , for which you have to proxy service
#kubectl proxy
Step 2 : get the kubenetes service and deployment files here ( https://github.com/beeyeas/graylog-kube ), clone repo
Step 3 : Create mongo, elasticsearch, graylog
#kubectl create -f mongo-service.yaml,mongo-deployment.yaml
#kubectl create -f elasticsearch-deployment.yaml,elasticsearch-service.yaml
#kubectl create -f graylog-deployment.yaml,graylog-service.yaml
Step 4 : forward graylog UI to local 19000 port
#kubectl port-forward graylog-2041601814-5qnbc 9000:9000
Step 5 : Verify if all services are up
#kubectl get services
NAME CLUSTER-IP EXTERNAL-IP PORT(S) AGE
elasticsearch None <none> 55555/TCP 1h
graylog 10.3.248.24 <none> 9000/TCP,12201/TCP 1h
kubernetes 10.3.240.1 <none> 443/TCP 1d
mongo None <none> 55555/TCP 1h
NOTE: Access localhost:9000 for graylog UI
Step 6 : Graylog UI is empty and do not have any logs to index or show , i have exposed port number 12201. Create a port forward for graylog input GELF HTTP
Make sure you got this screen configured in graylog, configurig GELF-HTTP in graylog

#kubectl port-forward graylog-2041601814-5qnbc 12201:12201
Step 7 : Now we can pump some test log statements into graylog from localhost
After step 7 where you pump the logs, see if logs are showing up in the graylog UI

Tuesday, February 28, 2017
GKE - Google Container Engine
Google Container (with K) Engine aka GKE is a container solution from google cloud platform (GCP)
#kubectl get namespaces
- GCP : https://cloud.google.com/container-engine/
- Kubernetes undeneath
- MS-Azure : https://azure.microsoft.com/en-us/services/container-service/
- Docker swarm
- DC/OS
- Kubenetes
- Amazon AWS : http://docs.aws.amazon.com/AmazonECS/latest/developerguide/ECS_instances.html
How to start with GKE?
- I assume you have a cloud.google.com account signed up with your gmail account, need credit card (but $300 credit) for 60 days
- https://cloud.google.com/container-engine/

- View My Console

- Remember to download "gcloud" https://cloud.google.com/sdk/docs/quickstart-mac-os-x
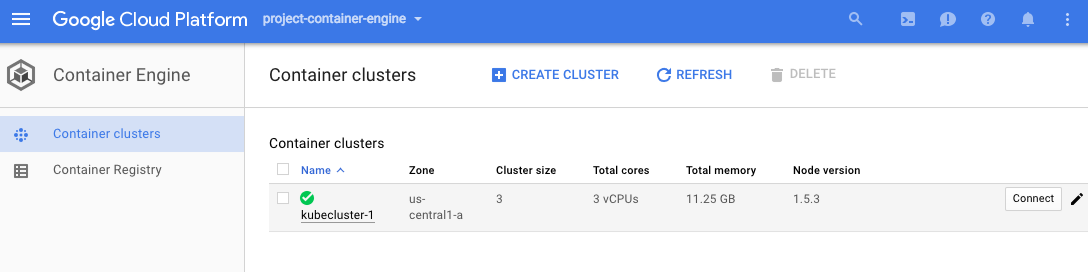
- My cluster is called "kubecluster-1"
- Once i have gcloud init and installed , set up the auth by gcloud auth list
- Sample kubectl command shows it works

NAME STATUS AGE
default Active 1h
kube-system Active 1h
voila, kube is up
Thursday, February 23, 2017
How to run graylog cluster in kubernetes
Graylog is the splunk equivalent for log collection, indexing , search analysis function.
I am playing around with it little bit and seeing the functions, so i need a quick installed version in
- If OS X install minikube https://kubernetes.io/docs/getting-started-guides/minikube/#minikube-features
- Running graylog cluster :
- #kubectl run graylog --image=graylog2/allinone --port=9000
- Forward TCP:9000 to show the graylog UI
- #kubectl port-forward graylog-2473246842-b6rhg 9000 &
- To view UI : point your browser to : http://127.0.0.1:9000
- admin/admin is the default username and password
- To view logs of graylog pods :
- #kubectl get pods ( this should give an output of running graylog container instance )
- #kubectl logs graylog-2473246842-b6rhg

Thursday, February 16, 2017
Data Analytics / Data Pipeline PANKCAKE
- Data Analytics / Data Pipeline
- PANCAKE stack
- PrestoDB : https://prestodb.io/ : Distributed SQL for big data ( HIVE, HBASE, cassandra , any SQL
- Arrow : Apache arrow ( https://arrow.apache.org/ ) , high performing columnar-in memory
- Nifi : https://blogs.apache.org/nifi/ ( big fat 700MB) Excellent tool for graphing and data routing , transformation, visualization
- Cassandra : http://cassandra.apache.org/ : Clustered no sql DB , written in java
- Airflow : https://github.com/apache/incubator-airflow : Orchestrator, work flow engine, configure hadoop jobs and direct the scheduler
- Kafka : https://kafka.apache.org/ : High speed messaging
- ElasticSearch
- Other Tools
- Apache-Spark :
- TensorFlow
- Algebird
- CoreNLP
- Kibana
- Apache Zeppelin : Multi-purpose Notebook for
- Data Ingestion
- Data Discovery
- Data Analytics
- Data Visualization and Collaboration
- PIG scripts and Map Reduce scripts
- http://pipeline.io/ : Optimizing tensor flow for prod
- http://jupyter.org/ : Awesome online tool to have shared notepad, code ,
- PMML : Predictive model markup language : JPMML : Java PMML ( https://www.ibm.com/developerworks/library/ba-ind-PMML1/ )
Working on a goal to bring this up in simple kubenetes cluster.
minikube ( playgroud for kubernetes )
Exercise Goal : Bring up minikube ( kubernetes ) in local VM
Bringing up minikube (kubenetes) + weave scope ( a monitoring stack ) in local laptop
- Minikube
- I am on OS X Darwin, I got virtual box installed
- Lets get started https://github.com/kubernetes/minikube
- Install below if not exist, “Requirements"
- xhyve driver, VirtualBox or VMware Fusion installation
- Get minikube latest release
- Follow instructions as in the page , minikube start …
- I got the dashboard on by
- minikube dashboard
- More links https://medium.com/@claudiopro/getting-started-with-kubernetes-via-minikube-ada8c7a29620#.gc87faxvq
- http://blog.kubernetes.io/2016/07/minikube-easily-run-kubernetes-locally.html
#minikube addons list
- registry-creds: disabled
- addon-manager: enabled
- dashboard: enabled
- kube-dns: enabled
- heapster: disabled
- ingress: disabled
I could not successfully bring in weave, i like it better graphically, but all i got it heapster for now
#minikube addons enable heapster
heapster was successfully enabled
Kubectl Drain
#kubectl drain minikube —force
This node minikube will be drained and all services will be stopped by force, there is an option to provide grace time.
To recover a node which has drained
#kubectl uncordon minikube
Heapster – the influx , graphana, dashboard for kube
#minikube addons open heapster
This should open a browser and graphana showing pods, cluster
Monday, February 13, 2017
Serverless ( AWS : Lambda / GCP:Cloud Functions / Azure:Functions )
Serverless
I am writing this as i exploring the infrastructure and landscape of serverless in early 2017.
Lately i see the adoption to serverless is drastic and really see the need for it every month i have to check the bills.
I was telling people that serverless is the solution to big fat bills from cloud providers. In turn what really that means is serverless is the way of standing up applications, databases, ETL jobs , web servers etc... in simple and quick way , where the huge operational cost of standing up virtual machines with operating system is not needed. Indeed the application runs as simple function instance.
AWS : Lamba
GCP : Cloud Functions
Azure : Functions
Are the available famous serverless architectures.
Marriage of containers and serverless
as i write here, there are lots of momentum on container (docker) supporting the serverless infrastructure.
Hypernetes
Hyper.sh
Reference : https://www.hyper.sh/
I am writing this as i exploring the infrastructure and landscape of serverless in early 2017.
Lately i see the adoption to serverless is drastic and really see the need for it every month i have to check the bills.
I was telling people that serverless is the solution to big fat bills from cloud providers. In turn what really that means is serverless is the way of standing up applications, databases, ETL jobs , web servers etc... in simple and quick way , where the huge operational cost of standing up virtual machines with operating system is not needed. Indeed the application runs as simple function instance.
AWS : Lamba
GCP : Cloud Functions
Azure : Functions
Are the available famous serverless architectures.
Marriage of containers and serverless
as i write here, there are lots of momentum on container (docker) supporting the serverless infrastructure.
Hypernetes
Hypernetes is a secure, multi-tenant Kubernetes distro. Simply put,
https://github.com/hyperhq/hypernetesHyper.sh
Reference : https://www.hyper.sh/
Friday, February 10, 2017
Tricks using GCP for begginers
Tracking Some gcloud commands
This creates a file ~/.kube/config and stores the downloaded user information session in here.
Launch kubectl proxy or #kubectl cluster-info this uses this application login details to function.
- I see the application login authentication need your browser to use the google id and password.
This creates a file ~/.kube/config and stores the downloaded user information session in here.
Launch kubectl proxy or #kubectl cluster-info this uses this application login details to function.
gcloud auth application-default login
Kubernetes cluster on GCP for Dummies
Agenda : Bring up kubernetes cluster on Google Cloud Platform
Reference : https://github.com/kelseyhightower/kubernetes-the-hard-way
Result
I got the cluster up and working and when i tried to install kube-dashboard, it did not work.
"Unauthorized" error when accessed web UI.
Screens


Some more readings : https://thehftguy.com/2016/06/15/gce-vs-aws-in-2016-why-you-should-never-use-amazon/
Reference : https://github.com/kelseyhightower/kubernetes-the-hard-way
- Bring up https://cloud.google.com, sign in as your google id or create a new google account. Note : Currently $300 is free per account on GCP, *still need credit card
- Follow the instruction in the reference section https://github.com/kelseyhightower/kubernetes-the-hard-way
Sequence of steps
- Cloud Infrastructure Provisioning
- Setting up a CA and TLS Cert Generation
- Bootstrapping an H/A etcd cluster
- Bootstrapping an H/A Kubernetes Control Plane
- Bootstrapping Kubernetes Workers
- Configuring the Kubernetes Client - Remote Access
- Managing the Container Network Routes
- Deploying the Cluster DNS Add-on
- Smoke Test
- Cleaning Up
I got the cluster up and working and when i tried to install kube-dashboard, it did not work.
"Unauthorized" error when accessed web UI.
Screens


Some more readings : https://thehftguy.com/2016/06/15/gce-vs-aws-in-2016-why-you-should-never-use-amazon/
Thursday, January 26, 2017
Public Cloud Monitoring and Diagnostic tools
As i was exploring tools on the microsoft azure and actively deploying applications.
Around 300 some VMs and lots of network constructs with VLANs and subnets.
I was looking for a one stop shop / single pane of glass tool for public cloud ( azure ) and local DC server applications , and hybrid monitoring tool.
I see the eco-system has good momentum and lots of thrid party applications claiming the
Around 300 some VMs and lots of network constructs with VLANs and subnets.
I was looking for a one stop shop / single pane of glass tool for public cloud ( azure ) and local DC server applications , and hybrid monitoring tool.
I see the eco-system has good momentum and lots of thrid party applications claiming the
- https://stackify.com/
- http://www.cerebrata.com/products/azure-diagnostics-manager
- http://cloudmonix.com/ ( lots of visualization graphs and drill down ability )
- https://www.unigma.com/
Some other tools
- https://www.upguard.com/features, I personally like these features
- Configuration search
- Scalable Anomaly Detection
- Time-lapse Collaboration View
- Visual Difference at its core
- https://www.opsclarity.com/product/features/
- Automated Topology Discovery
- Infrastructure Host map
- APIs
- Identity and Access : https://jumpcloud.com/daas-product/index
- User Management
- Device Management
- SSO
- Active Directory Bridge
- LDAP-aas
- MFA
- https://www.moogsoft.com/product/
- Real-time anomaly detection
- Closed loop remediation
- Production workbench
Tuesday, January 24, 2017
cadvisor , influx and grafanna
1.sudo docker run -d -p 8083:8083 -p 8086:8086 --expose 8090 --expose 8099 --name influxsrv tutum/influxdb
2.sudo docker run --volume=/:/rootfs:ro --volume=/var/run:/var/run:rw --volume=/sys:/sys:ro --volume=/var/lib/docker/:/var/lib/docker:ro --publish 8080:8080 --detach=true --link influxsrv:influxsrv --name=cadvisor google/cadvisor:latest -storage_driver_db=influxdb -storage_driver_host=influxsrv:8086
3.sudo docker run -d -p 3000:3000 -e INFLUXDB_HOST=localhost -e INFLUXDB_PORT=8086 -e INFLUXDB_NAME=cadvisor -e INFLUXDB_USER=root -e INFLUXDB_PASS=root --link influxsrv:influxsrv --name grafana grafana/grafana
# git repo for remote TTY over the web # git clone https://github.com/krishnasrinivas/wetty
4. sudo docker run --name term -p 3000 -dt nathanleclaire/wetty
Monday, January 23, 2017
Linux Process Management - S6
http://skarnet.org/software/s6/overview.html
S6 is a process management tool , built from ground up. Based upon reliable libraries
https://skarnet.org/software/s6/why.html
Purpose : To manage any process inside a operating system , restart if needed.
Some examples of s6 programs meant to be used in run scripts:
S6 is a process management tool , built from ground up. Based upon reliable libraries
https://skarnet.org/software/s6/why.html
Purpose : To manage any process inside a operating system , restart if needed.
Some examples of s6 programs meant to be used in run scripts:
- The s6-log program is a long-lived process. It is meant to be executed into by a ./log/run script: it will be supervised, and will process what it reads on its stdin (i.e. the output of the ./run daemon).
- The s6-envdir program is a short-lived process that will update its current environment according to what it reads in a given directory, then execute into the rest of its command line. It is meant to be used in a run script to adjust the environment with which the final daemon will be executed into.
- Similarly, the s6-softlimit program adjusts its resource limits, then executes into the rest of its command line: it is meant to set the resources the final daemon will have access to.
- The s6-applyuidgid program, part of the s6-*uidgid family, drops root privileges before executing into the rest of its command line: it is meant to be used in run scripts that need root privileges when starting but do not need it for the execution of the long-lived process.
- s6-ipcserverd is a daemon that listens to a Unix socket and spawns a program for every connection. It is meant to be supervised, so it should be used in a run script, and it's also meant to be a flexible super-server that you can use for different applications: so it is a building block that may appear in several of your run scripts defining local services.
Subscribe to:
Posts (Atom)